MONEY
Massachusetts, Rhode Island, New York among states that spend most on the lottery
24/7 Wall Street
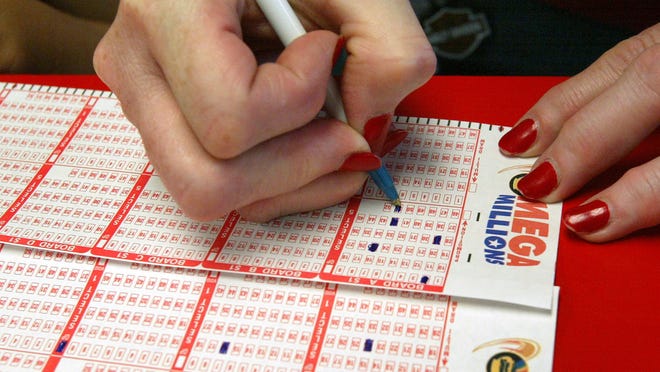
Americans spent $71.8 billion on lottery tickets in 2017, about $285 per adult. 24/7 Wall St. analyzed census data to identify which states spend the most on the lottery and how much the average adult spends on the lottery in every in state.
Tim Boyle / Getty Images
1. Alabama*
• Lottery spending per adult: N/A
• Total lottery ticket sales: N/A
• Prize money awarded in 2017: N/A
• Median household income: $49,861 (6th lowest)
*No state lottery.
Jacqueline Nix / Getty Images• Lottery spending per adult: N/A
• Total lottery ticket sales: N/A
• Prize money awarded in 2017: N/A
• Median household income: $49,861 (6th lowest)
*No state lottery.

2. Alaska*
• Lottery spending per adult: N/A
• Total lottery ticket sales: N/A
• Prize money awarded in 2017: N/A
• Median household income: $74,346 (8th highest)
*No state lottery.
Urbanglimpses / Getty Images• Lottery spending per adult: N/A
• Total lottery ticket sales: N/A
• Prize money awarded in 2017: N/A
• Median household income: $74,346 (8th highest)
*No state lottery.

3. Arizona
• Lottery spending per adult: $150.79 (14th lowest)
• Total lottery ticket sales: $811.8 million (22nd highest)
• Prize money awarded in 2017: $557.4 million ($103.55 per adult)
• Median household income: $59,246 (24th lowest)
Dreamframer / Getty Images• Lottery spending per adult: $150.79 (14th lowest)
• Total lottery ticket sales: $811.8 million (22nd highest)
• Prize money awarded in 2017: $557.4 million ($103.55 per adult)
• Median household income: $59,246 (24th lowest)

4. Arkansas
• Lottery spending per adult: $184.61 (16th lowest)
• Total lottery ticket sales: $423.8 million (14th lowest)
• Prize money awarded in 2017: $306.4 million ($133.47 per adult)
• Median household income: $47,062 (3rd lowest)
Sean Pavone / Getty Images• Lottery spending per adult: $184.61 (16th lowest)
• Total lottery ticket sales: $423.8 million (14th lowest)
• Prize money awarded in 2017: $306.4 million ($133.47 per adult)
• Median household income: $47,062 (3rd lowest)

5. California
• Lottery spending per adult: $204.52 (17th lowest)
• Total lottery ticket sales: $6.2 billion (2nd highest)
• Prize money awarded in 2017: $4.0 billion ($130.04 per adult)
• Median household income: $75,277 (6th highest)
Choness / Getty Images• Lottery spending per adult: $204.52 (17th lowest)
• Total lottery ticket sales: $6.2 billion (2nd highest)
• Prize money awarded in 2017: $4.0 billion ($130.04 per adult)
• Median household income: $75,277 (6th highest)

6. Colorado
• Lottery spending per adult: $118.44 (9th lowest)
• Total lottery ticket sales: $514.6 million (18th lowest)
• Prize money awarded in 2017: $341.5 million ($78.60 per adult)
• Median household income: $71,953 (11th highest)
Milehightraveler / Getty Images• Lottery spending per adult: $118.44 (9th lowest)
• Total lottery ticket sales: $514.6 million (18th lowest)
• Prize money awarded in 2017: $341.5 million ($78.60 per adult)
• Median household income: $71,953 (11th highest)

7. Connecticut
• Lottery spending per adult: $403.48 (9th highest)
• Total lottery ticket sales: $1.1 billion (18th highest)
• Prize money awarded in 2017: $756.3 million ($265.75 per adult)
• Median household income: $76,348 (5th highest)
SeanPavonePhoto / Getty Images• Lottery spending per adult: $403.48 (9th highest)
• Total lottery ticket sales: $1.1 billion (18th highest)
• Prize money awarded in 2017: $756.3 million ($265.75 per adult)
• Median household income: $76,348 (5th highest)

8. Delaware
• Lottery spending per adult: $607.34 (3rd highest)
• Total lottery ticket sales: $460.1 million (16th lowest)
• Prize money awarded in 2017: $135.0 million ($178.13 per adult)
• Median household income: $64,805 (16th highest)
Ultima_Gaina / Getty Images• Lottery spending per adult: $607.34 (3rd highest)
• Total lottery ticket sales: $460.1 million (16th lowest)
• Prize money awarded in 2017: $135.0 million ($178.13 per adult)
• Median household income: $64,805 (16th highest)
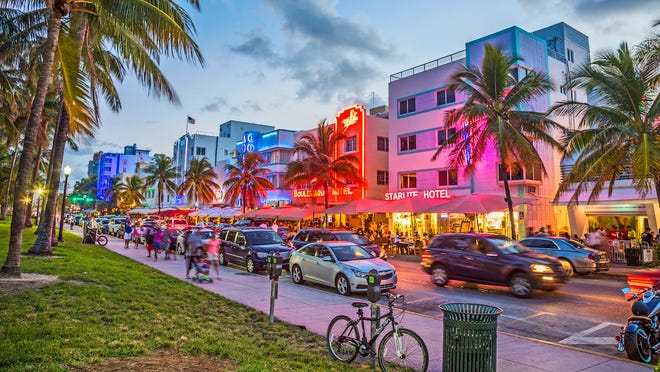
9. Florida
• Lottery spending per adult: $346.73 (13th highest)
• Total lottery ticket sales: $5.8 billion (3rd highest)
• Prize money awarded in 2017: $4.0 billion ($238.13 per adult)
• Median household income: $55,462 (14th lowest)
Meinzahn / IStock• Lottery spending per adult: $346.73 (13th highest)
• Total lottery ticket sales: $5.8 billion (3rd highest)
• Prize money awarded in 2017: $4.0 billion ($238.13 per adult)
• Median household income: $55,462 (14th lowest)

10. Georgia
• Lottery spending per adult: $507.46 (5th highest)
• Total lottery ticket sales: $4.0 billion (6th highest)
• Prize money awarded in 2017: $2.7 billion ($345.88 per adult)
• Median household income: $58,756 (23rd lowest)
Sean Pavone / Getty Images• Lottery spending per adult: $507.46 (5th highest)
• Total lottery ticket sales: $4.0 billion (6th highest)
• Prize money awarded in 2017: $2.7 billion ($345.88 per adult)
• Median household income: $58,756 (23rd lowest)

11. Hawaii
• Lottery spending per adult: N/A
• Total lottery ticket sales: N/A
• Prize money awarded in 2017: N/A
• Median household income: $80,212 (3rd highest)
YinYang / Getty Images• Lottery spending per adult: N/A
• Total lottery ticket sales: N/A
• Prize money awarded in 2017: N/A
• Median household income: $80,212 (3rd highest)

12. Idaho
• Lottery spending per adult: $173.90 (15th lowest)
• Total lottery ticket sales: $221.5 million (9th lowest)
• Prize money awarded in 2017: $160.3 million ($125.86 per adult)
• Median household income: $55,583 (15th lowest)
Mattalberts / Getty Images• Lottery spending per adult: $173.90 (15th lowest)
• Total lottery ticket sales: $221.5 million (9th lowest)
• Prize money awarded in 2017: $160.3 million ($125.86 per adult)
• Median household income: $55,583 (15th lowest)

13. Illinois
• Lottery spending per adult: $287.07 (16th highest)
• Total lottery ticket sales: $2.8 billion (10th highest)
• Prize money awarded in 2017: $1.8 billion ($183.72 per adult)
• Median household income: $65,030 (15th highest)
Lhongfoto / Getty Images• Lottery spending per adult: $287.07 (16th highest)
• Total lottery ticket sales: $2.8 billion (10th highest)
• Prize money awarded in 2017: $1.8 billion ($183.72 per adult)
• Median household income: $65,030 (15th highest)

14. Indiana
• Lottery spending per adult: $222.19 (18th lowest)
• Total lottery ticket sales: $1.1 billion (19th highest)
• Prize money awarded in 2017: $774.4 million ($152.06 per adult)
• Median household income: $55,746 (17th lowest)
F11photo / Getty Images• Lottery spending per adult: $222.19 (18th lowest)
• Total lottery ticket sales: $1.1 billion (19th highest)
• Prize money awarded in 2017: $774.4 million ($152.06 per adult)
• Median household income: $55,746 (17th lowest)

15. Iowa
• Lottery spending per adult: $145.83 (13th lowest)
• Total lottery ticket sales: $352.2 million (13th lowest)
• Prize money awarded in 2017: $215.6 million ($89.27 per adult)
• Median household income: $59,955 (25th highest)
KudicM / Getty Images• Lottery spending per adult: $145.83 (13th lowest)
• Total lottery ticket sales: $352.2 million (13th lowest)
• Prize money awarded in 2017: $215.6 million ($89.27 per adult)
• Median household income: $59,955 (25th highest)

16. Kansas
• Lottery spending per adult: $110.29 (6th lowest)
• Total lottery ticket sales: $242.7 million (10th lowest)
• Prize money awarded in 2017: $149.7 million ($68.03 per adult)
• Median household income: $58,218 (21st lowest)
Davel5957 / Getty Images• Lottery spending per adult: $110.29 (6th lowest)
• Total lottery ticket sales: $242.7 million (10th lowest)
• Prize money awarded in 2017: $149.7 million ($68.03 per adult)
• Median household income: $58,218 (21st lowest)

17. Kentucky
• Lottery spending per adult: $269.01 (19th highest)
• Total lottery ticket sales: $925.3 million (21st highest)
• Prize money awarded in 2017: $628.8 million ($182.82 per adult)
• Median household income: $50,247 (7th lowest)
Sean Pavone / Getty Images• Lottery spending per adult: $269.01 (19th highest)
• Total lottery ticket sales: $925.3 million (21st highest)
• Prize money awarded in 2017: $628.8 million ($182.82 per adult)
• Median household income: $50,247 (7th lowest)

18. Louisiana
• Lottery spending per adult: $120.13 (11th lowest)
• Total lottery ticket sales: $429.5 million (15th lowest)
• Prize money awarded in 2017: $242.9 million ($67.96 per adult)
• Median household income: $47,905 (5th lowest)
F11photo / Getty Images• Lottery spending per adult: $120.13 (11th lowest)
• Total lottery ticket sales: $429.5 million (15th lowest)
• Prize money awarded in 2017: $242.9 million ($67.96 per adult)
• Median household income: $47,905 (5th lowest)

19. Maine
• Lottery spending per adult: $229.56 (21st lowest)
• Total lottery ticket sales: $248.3 million (11th lowest)
• Prize money awarded in 2017: $171.8 million ($158.79 per adult)
• Median household income: $55,602 (16th lowest)
SeanPavonePhoto / Getty Images• Lottery spending per adult: $229.56 (21st lowest)
• Total lottery ticket sales: $248.3 million (11th lowest)
• Prize money awarded in 2017: $171.8 million ($158.79 per adult)
• Median household income: $55,602 (16th lowest)
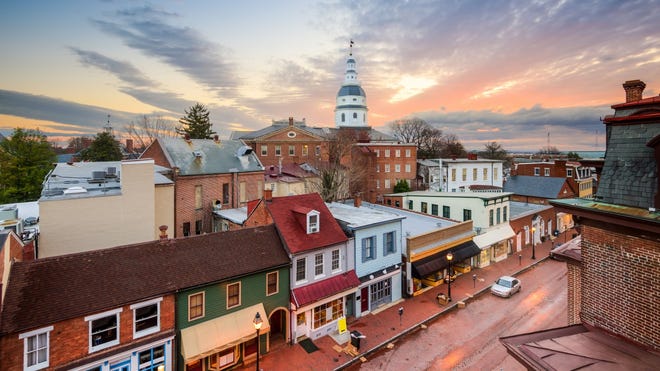
20. Maryland
• Lottery spending per adult: $409.77 (8th highest)
• Total lottery ticket sales: $1.9 billion (13th highest)
• Prize money awarded in 2017: $1.3 billion ($286.88 per adult)
• Median household income: $83,242 (the highest)
SeanPavonePhoto / Getty Images• Lottery spending per adult: $409.77 (8th highest)
• Total lottery ticket sales: $1.9 billion (13th highest)
• Prize money awarded in 2017: $1.3 billion ($286.88 per adult)
• Median household income: $83,242 (the highest)

21. Massachusetts
• Lottery spending per adult: $926.71 (the highest)
• Total lottery ticket sales: $5.1 billion (4th highest)
• Prize money awarded in 2017: $3.7 billion ($668.52 per adult)
• Median household income: $79,835 (4th highest)
DenisTangneyJr / Getty Images• Lottery spending per adult: $926.71 (the highest)
• Total lottery ticket sales: $5.1 billion (4th highest)
• Prize money awarded in 2017: $3.7 billion ($668.52 per adult)
• Median household income: $79,835 (4th highest)

22. Michigan
• Lottery spending per adult: $387.72 (10th highest)
• Total lottery ticket sales: $3.0 billion (8th highest)
• Prize money awarded in 2017: $2.0 billion ($262.52 per adult)
• Median household income: $56,697 (20th lowest)
Pawel.gaul / Getty Images• Lottery spending per adult: $387.72 (10th highest)
• Total lottery ticket sales: $3.0 billion (8th highest)
• Prize money awarded in 2017: $2.0 billion ($262.52 per adult)
• Median household income: $56,697 (20th lowest)

23. Minnesota
• Lottery spending per adult: $120.13 (10th lowest)
• Total lottery ticket sales: $514.0 million (17th lowest)
• Prize money awarded in 2017: $351.7 million ($82.19 per adult)
• Median household income: $70,315 (13th highest)
Scruggelgreen / Getty Images• Lottery spending per adult: $120.13 (10th lowest)
• Total lottery ticket sales: $514.0 million (17th lowest)
• Prize money awarded in 2017: $351.7 million ($82.19 per adult)
• Median household income: $70,315 (13th highest)

24. Mississippi*
• Lottery spending per adult: N/A
• Total lottery ticket sales: N/A
• Prize money awarded in 2017: N/A
• Median household income: $44,717 (2nd lowest)
*State lottery not in effect in 2017.
Damian Entwistle From Nelson, Lancashire, England / Wikimedia Commons• Lottery spending per adult: N/A
• Total lottery ticket sales: N/A
• Prize money awarded in 2017: N/A
• Median household income: $44,717 (2nd lowest)
*State lottery not in effect in 2017.
25. Missouri
• Lottery spending per adult: $267.50 (20th highest)
• Total lottery ticket sales: $1.3 billion (17th highest)
• Prize money awarded in 2017: $932.1 million ($197.23 per adult)
• Median household income: $54,478 (12th lowest)
JTGrafix / Getty Images• Lottery spending per adult: $267.50 (20th highest)
• Total lottery ticket sales: $1.3 billion (17th highest)
• Prize money awarded in 2017: $932.1 million ($197.23 per adult)
• Median household income: $54,478 (12th lowest)

26. Montana
• Lottery spending per adult: $77.05 (4th lowest)
• Total lottery ticket sales: $63.2 million (3rd lowest)
• Prize money awarded in 2017: $33.7 million ($41.04 per adult)
• Median household income: $55,328 (13th lowest)
EJ-J / Getty Images• Lottery spending per adult: $77.05 (4th lowest)
• Total lottery ticket sales: $63.2 million (3rd lowest)
• Prize money awarded in 2017: $33.7 million ($41.04 per adult)
• Median household income: $55,328 (13th lowest)

27. Nebraska
• Lottery spending per adult: $112.55 (7th lowest)
• Total lottery ticket sales: $162.7 million (8th lowest)
• Prize money awarded in 2017: $101.9 million ($70.50 per adult)
• Median household income: $59,566 (25th lowest)
DenisTangneyJr / Getty Images• Lottery spending per adult: $112.55 (7th lowest)
• Total lottery ticket sales: $162.7 million (8th lowest)
• Prize money awarded in 2017: $101.9 million ($70.50 per adult)
• Median household income: $59,566 (25th lowest)

28. Nevada*
• Lottery spending per adult: N/A
• Total lottery ticket sales: N/A
• Prize money awarded in 2017: N/A
• Median household income: $58,646 (22nd lowest)
*No state lottery.
F11photo / Getty Images• Lottery spending per adult: N/A
• Total lottery ticket sales: N/A
• Prize money awarded in 2017: N/A
• Median household income: $58,646 (22nd lowest)
*No state lottery.

29. New Hampshire
• Lottery spending per adult: $264.63 (21st highest)
• Total lottery ticket sales: $287.0 million (12th lowest)
• Prize money awarded in 2017: $191.8 million ($176.82 per adult)
• Median household income: $74,991 (7th highest)
DenisTangneyJr / Getty Images• Lottery spending per adult: $264.63 (21st highest)
• Total lottery ticket sales: $287.0 million (12th lowest)
• Prize money awarded in 2017: $191.8 million ($176.82 per adult)
• Median household income: $74,991 (7th highest)

30. New Jersey
• Lottery spending per adult: $427.65 (6th highest)
• Total lottery ticket sales: $3.0 billion (9th highest)
• Prize money awarded in 2017: $2.0 billion ($280.71 per adult)
• Median household income: $81,740 (2nd highest)
Espiegle / Getty Images• Lottery spending per adult: $427.65 (6th highest)
• Total lottery ticket sales: $3.0 billion (9th highest)
• Prize money awarded in 2017: $2.0 billion ($280.71 per adult)
• Median household income: $81,740 (2nd highest)

31. New Mexico
• Lottery spending per adult: $78.86 (5th lowest)
• Total lottery ticket sales: $126.0 million (5th lowest)
• Prize money awarded in 2017: $67.2 million ($42.03 per adult)
• Median household income: $47,169 (4th lowest)
Muha04 / Getty Images• Lottery spending per adult: $78.86 (5th lowest)
• Total lottery ticket sales: $126.0 million (5th lowest)
• Prize money awarded in 2017: $67.2 million ($42.03 per adult)
• Median household income: $47,169 (4th lowest)

32. New York
• Lottery spending per adult: $530.72 (4th highest)
• Total lottery ticket sales: $8.3 billion (the highest)
• Prize money awarded in 2017: $4.6 billion ($295.56 per adult)
• Median household income: $67,844 (14th highest)
TomasSereda / Getty Images• Lottery spending per adult: $530.72 (4th highest)
• Total lottery ticket sales: $8.3 billion (the highest)
• Prize money awarded in 2017: $4.6 billion ($295.56 per adult)
• Median household income: $67,844 (14th highest)

33. North Carolina
• Lottery spending per adult: $283.31 (18th highest)
• Total lottery ticket sales: $2.3 billion (12th highest)
• Prize money awarded in 2017: $1.5 billion ($193.50 per adult)
• Median household income: $53,855 (11th lowest)
SeanPavonePhoto / Getty Images• Lottery spending per adult: $283.31 (18th highest)
• Total lottery ticket sales: $2.3 billion (12th highest)
• Prize money awarded in 2017: $1.5 billion ($193.50 per adult)
• Median household income: $53,855 (11th lowest)

34. North Dakota
• Lottery spending per adult: $45.27 (the lowest)
• Total lottery ticket sales: $26.4 million (2nd lowest)
• Prize money awarded in 2017: $14.3 million ($24.60 per adult)
• Median household income: $63,837 (18th highest)
DenisTangneyJr / Getty Images• Lottery spending per adult: $45.27 (the lowest)
• Total lottery ticket sales: $26.4 million (2nd lowest)
• Prize money awarded in 2017: $14.3 million ($24.60 per adult)
• Median household income: $63,837 (18th highest)

35. Ohio
• Lottery spending per adult: $310.93 (14th highest)
• Total lottery ticket sales: $2.8 billion (11th highest)
• Prize money awarded in 2017: $1.9 billion ($210.90 per adult)
• Median household income: $56,111 (18th lowest)
AndreyKrav / Getty Images• Lottery spending per adult: $310.93 (14th highest)
• Total lottery ticket sales: $2.8 billion (11th highest)
• Prize money awarded in 2017: $1.9 billion ($210.90 per adult)
• Median household income: $56,111 (18th lowest)

36. Oklahoma
• Lottery spending per adult: $51.02 (2nd lowest)
• Total lottery ticket sales: $151.5 million (6th lowest)
• Prize money awarded in 2017: $73.3 million ($24.70 per adult)
• Median household income: $51,924 (8th lowest)
DenisTangneyJr / Getty Images• Lottery spending per adult: $51.02 (2nd lowest)
• Total lottery ticket sales: $151.5 million (6th lowest)
• Prize money awarded in 2017: $73.3 million ($24.70 per adult)
• Median household income: $51,924 (8th lowest)

37. Oregon
• Lottery spending per adult: $308.15 (15th highest)
• Total lottery ticket sales: $1.0 billion (20th highest)
• Prize money awarded in 2017: $217.2 million ($66.43 per adult)
• Median household income: $63,426 (19th highest)
Simonkr / Getty Images• Lottery spending per adult: $308.15 (15th highest)
• Total lottery ticket sales: $1.0 billion (20th highest)
• Prize money awarded in 2017: $217.2 million ($66.43 per adult)
• Median household income: $63,426 (19th highest)

38. Pennsylvania
• Lottery spending per adult: $366.98 (12th highest)
• Total lottery ticket sales: $3.7 billion (7th highest)
• Prize money awarded in 2017: $2.6 billion ($255.24 per adult)
• Median household income: $60,905 (21st highest)
F11photo / Getty Images• Lottery spending per adult: $366.98 (12th highest)
• Total lottery ticket sales: $3.7 billion (7th highest)
• Prize money awarded in 2017: $2.6 billion ($255.24 per adult)
• Median household income: $60,905 (21st highest)

39. Rhode Island
• Lottery spending per adult: $622.50 (2nd highest)
• Total lottery ticket sales: $530.8 million (19th lowest)
• Prize money awarded in 2017: $157.0 million ($184.16 per adult)
• Median household income: $64,340 (17th highest)
SeanPavonePhoto / Getty Images• Lottery spending per adult: $622.50 (2nd highest)
• Total lottery ticket sales: $530.8 million (19th lowest)
• Prize money awarded in 2017: $157.0 million ($184.16 per adult)
• Median household income: $64,340 (17th highest)
40. South Carolina
• Lottery spending per adult: $387.57 (11th highest)
• Total lottery ticket sales: $1.5 billion (15th highest)
• Prize money awarded in 2017: $1.1 billion ($276.90 per adult)
• Median household income: $52,306 (9th lowest)
Sean Pavone / Getty Images• Lottery spending per adult: $387.57 (11th highest)
• Total lottery ticket sales: $1.5 billion (15th highest)
• Prize money awarded in 2017: $1.1 billion ($276.90 per adult)
• Median household income: $52,306 (9th lowest)

41. South Dakota
• Lottery spending per adult: $232.52 (22nd lowest)
• Total lottery ticket sales: $152.6 million (7th lowest)
• Prize money awarded in 2017: $28.7 million ($43.78 per adult)
• Median household income: $56,274 (19th lowest)
JMichl / Getty Images• Lottery spending per adult: $232.52 (22nd lowest)
• Total lottery ticket sales: $152.6 million (7th lowest)
• Prize money awarded in 2017: $28.7 million ($43.78 per adult)
• Median household income: $56,274 (19th lowest)

42. Tennessee
• Lottery spending per adult: $261.32 (22nd highest)
• Total lottery ticket sales: $1.4 billion (16th highest)
• Prize money awarded in 2017: $948.3 million ($182.10 per adult)
• Median household income: $52,375 (10th lowest)
Benedek / Getty Images• Lottery spending per adult: $261.32 (22nd highest)
• Total lottery ticket sales: $1.4 billion (16th highest)
• Prize money awarded in 2017: $948.3 million ($182.10 per adult)
• Median household income: $52,375 (10th lowest)

43. Texas
• Lottery spending per adult: $229.29 (20th lowest)
• Total lottery ticket sales: $4.8 billion (5th highest)
• Prize money awarded in 2017: $3.3 billion ($155.56 per adult)
• Median household income: $60,629 (24th highest)
SeanPavonePhoto / Getty Images• Lottery spending per adult: $229.29 (20th lowest)
• Total lottery ticket sales: $4.8 billion (5th highest)
• Prize money awarded in 2017: $3.3 billion ($155.56 per adult)
• Median household income: $60,629 (24th highest)

44. Utah*
• Lottery spending per adult: N/A
• Total lottery ticket sales: N/A
• Prize money awarded in 2017: N/A
• Median household income: $71,414 (12th highest)
*No state lottery.
Adventure_Photo / Getty Images• Lottery spending per adult: N/A
• Total lottery ticket sales: N/A
• Prize money awarded in 2017: N/A
• Median household income: $71,414 (12th highest)
*No state lottery.

45. Vermont
• Lottery spending per adult: $227.08 (19th lowest)
• Total lottery ticket sales: $114.9 million (4th lowest)
• Prize money awarded in 2017: $79.6 million ($157.44 per adult)
• Median household income: $60,782 (22nd highest)
Sean Pavone / Getty Images• Lottery spending per adult: $227.08 (19th lowest)
• Total lottery ticket sales: $114.9 million (4th lowest)
• Prize money awarded in 2017: $79.6 million ($157.44 per adult)
• Median household income: $60,782 (22nd highest)

46. Virginia
• Lottery spending per adult: $284.45 (17th highest)
• Total lottery ticket sales: $1.9 billion (14th highest)
• Prize money awarded in 2017: $1.2 billion ($183.93 per adult)
• Median household income: $72,577 (10th highest)
Sean Pavone / Getty Images• Lottery spending per adult: $284.45 (17th highest)
• Total lottery ticket sales: $1.9 billion (14th highest)
• Prize money awarded in 2017: $1.2 billion ($183.93 per adult)
• Median household income: $72,577 (10th highest)

47. Washington
• Lottery spending per adult: $116.92 (8th lowest)
• Total lottery ticket sales: $673.3 million (22nd lowest)
• Prize money awarded in 2017: $499.3 million ($86.70 per adult)
• Median household income: $74,073 (9th highest)
Aiisha5 / IStock• Lottery spending per adult: $116.92 (8th lowest)
• Total lottery ticket sales: $673.3 million (22nd lowest)
• Prize money awarded in 2017: $499.3 million ($86.70 per adult)
• Median household income: $74,073 (9th highest)

48. West Virginia
• Lottery spending per adult: $422.99 (7th highest)
• Total lottery ticket sales: $610.1 million (21st lowest)
• Prize money awarded in 2017: $512.0 million ($354.92 per adult)
• Median household income: $44,097 (the lowest)
Sean Pavone / Getty Images• Lottery spending per adult: $422.99 (7th highest)
• Total lottery ticket sales: $610.1 million (21st lowest)
• Prize money awarded in 2017: $512.0 million ($354.92 per adult)
• Median household income: $44,097 (the lowest)

49. Wisconsin
• Lottery spending per adult: $125.96 (12th lowest)
• Total lottery ticket sales: $568.9 million (20th lowest)
• Prize money awarded in 2017: $363.0 million ($80.37 per adult)
• Median household income: $60,773 (23rd highest)
Ron_Thomas / Getty Images• Lottery spending per adult: $125.96 (12th lowest)
• Total lottery ticket sales: $568.9 million (20th lowest)
• Prize money awarded in 2017: $363.0 million ($80.37 per adult)
• Median household income: $60,773 (23rd highest)

50. Wyoming
• Lottery spending per adult: $57.43 (3rd lowest)
• Total lottery ticket sales: $25.3 million (the lowest)
• Prize money awarded in 2017: $14.5 million ($32.85 per adult)
• Median household income: $61,584 (20th highest)
Dean_Fikar / Getty Images• Lottery spending per adult: $57.43 (3rd lowest)
• Total lottery ticket sales: $25.3 million (the lowest)
• Prize money awarded in 2017: $14.5 million ($32.85 per adult)
• Median household income: $61,584 (20th highest)